FNB Menu Item Sales report
This report will generate revenue statistics from items sold in FnB during the common shift period, including the currently open common shift. However, please note that the data may not be accurate for the shift that has not yet been closed.
- Permission of report
To display this report, the following requirements must be met:
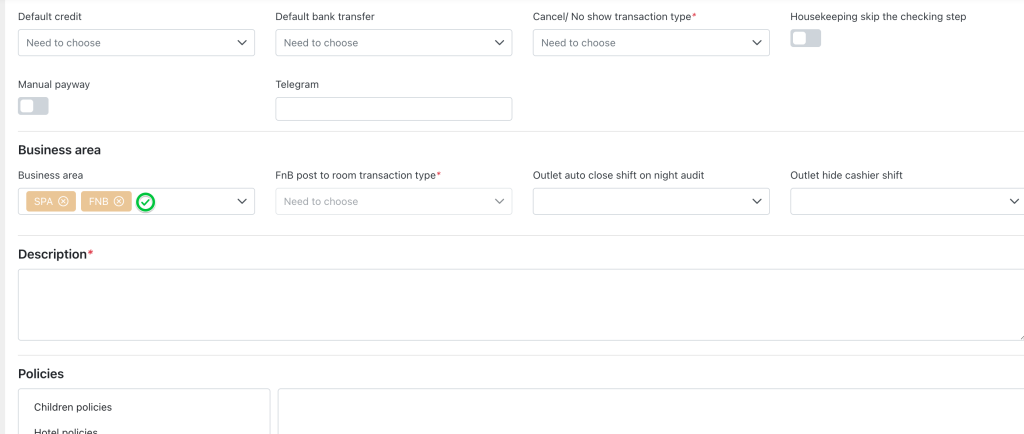
- In Config Hotel > Business area section, FNB option should be selected
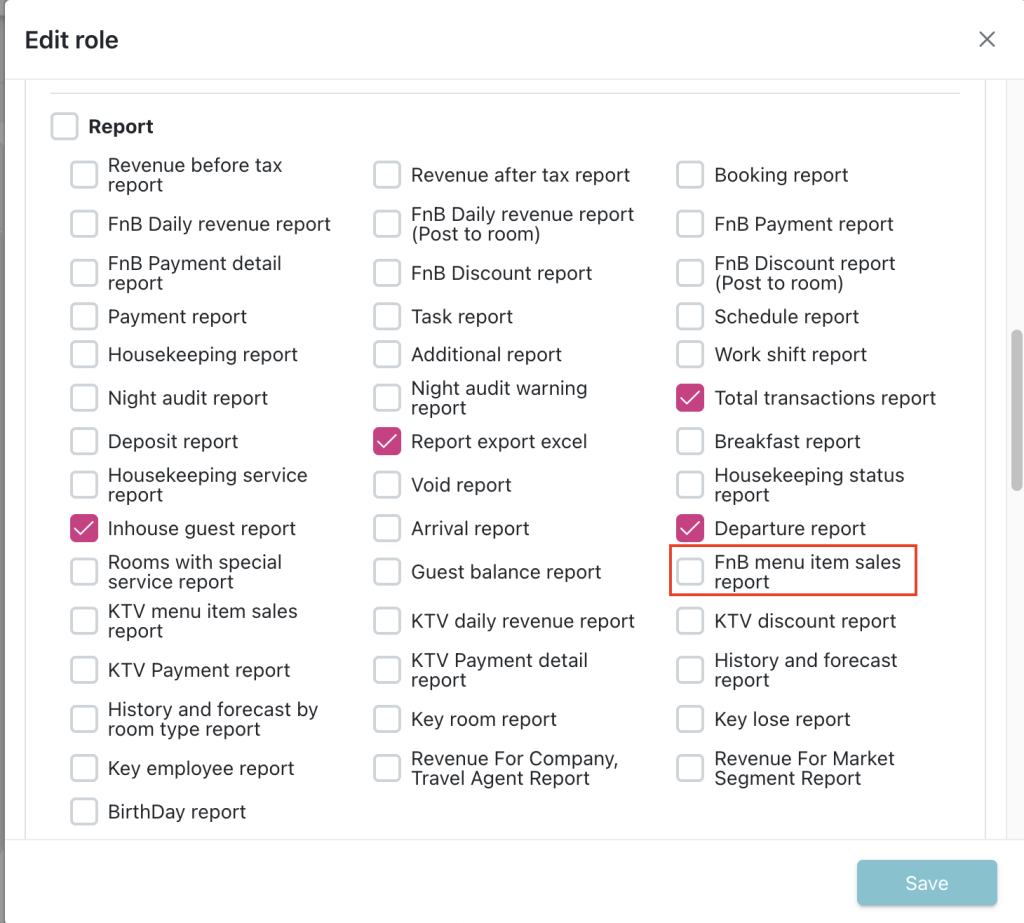
- In Config > Access Control, FnB menu item sales report is selected
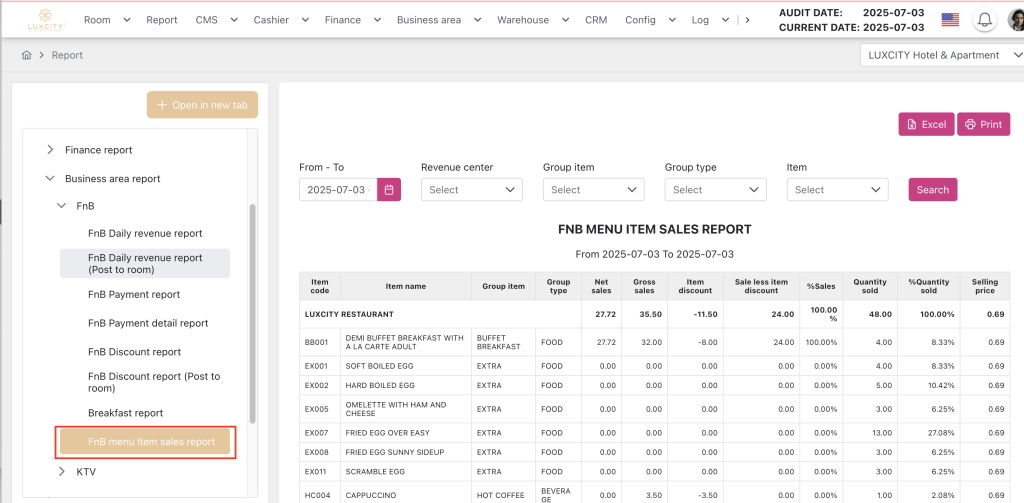
Then the report will be displayed in Report menu > FNB Report for verification.
- Create Group type for FnB menu item sales report
The system will use classification to differentiate which category the item belongs to. For example, food items will be classified as Food, and drinks will be classified as either Alcoholic or Non-alcoholic Beverages.
How to config:
- Navigate to Config > Business area > FnB > Classification tab
- Select the classification that has code as “REPORT_FNB_ITEM_SALES” (this one is auto generated by the system)
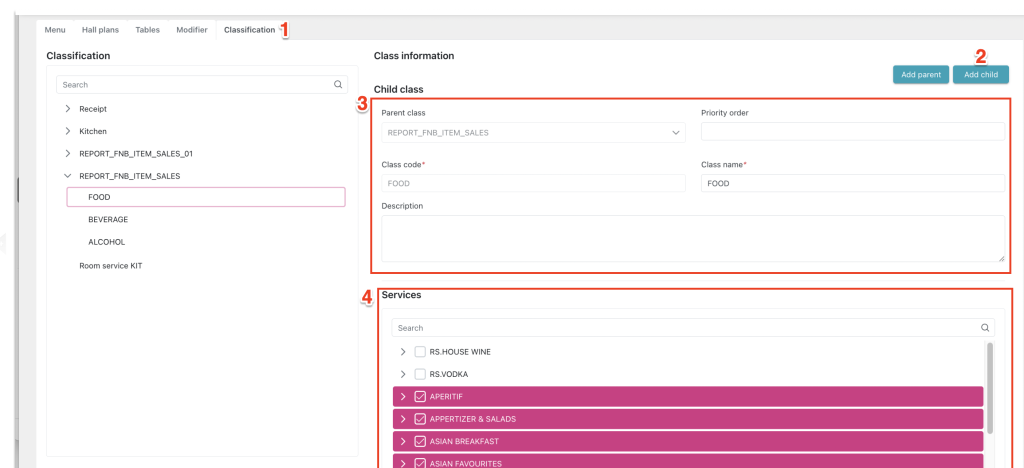
- Create child classification as desired in this classification (priority order is not required)
- Then assign items to this child classification
- FnB menu item sales report
- Filter section
- From – To: Search date range. After selecting the date range, the report data is automatically searched based on the date range and the selected filter conditions.
- Revenue center: Displays a list of FnB outlets that have data in the report for the filtered date range, and an option “All” that allows the user to automatically select multiple items from the list.
- Group item: Displays a list of service/product groups in FnB configured in Config > Business area > FnB > Menu tab that have data in the report for the filtered date range. Allows the user to search and select multiple group items to load the list of items based on the values selected in the Revenue center > Group type field.
- Group type: Displays a list of child classification configured by default under MenuItemSalesReport in Config > Business area > FnB > Classification tab, which have data in the report for the filtered date range.
- Item: Displays the list of outlet_items configured in Config > Business area > Outlet > Menu tab.
- Data section
- Revenue Center: Name of the outlet.
- Item Code: Code of the product/service assigned to the selector displayed in the corresponding outlet during the search period.
- Item Name: Name of the product/service corresponding to the code in the Item code column assigned to the outlet during the search period.
- Group Item: Group of products/services assigned to the outlet during the search period, configured in Config > Business area > FnB > Menu tab.
- Group Type: Type of product/service assigned to the outlet during the search period.
- Gross Sales: Total gross sales of each product/service at the corresponding outlet during the search period. The value is calculated from the total amount before discounts on the bills of each item in the corresponding outlet (including both bill payments and bills posted to rooms).
- Item Discount. Total discounts of each product/service at each corresponding outlet during the search period. The value is calculated from the total discount amount of each product/service on the bills of each outlet during the search period (including both bill payments and bills posted to rooms).
- Sale Less Item Discount: Total sales after discounts for each product/service at the corresponding outlet during the search period. The value is calculated from the total amount after discounts for each product/service on the bills of each outlet during the search period (including both bill payments and bills posted to rooms).
- % Sales: The percentage of sales for each item relative to the total services/products at the corresponding outlet during the search period. The formula = “TotalSaleLessItemDiscountByItem” / “TotalSaleLessItemDiscountByOutlet”.
- Quantity Sold: Total quantity sold for each service/product at the corresponding outlet during the search period. The value is calculated from the total quantity sold for each service/product on the bills of each outlet during the search period (including both bill payments and bills posted to rooms).
- % Quantity Sold: The percentage of quantity sold for each item relative to the total services/products at the corresponding outlet during the search period. The formula = “TotalQuantitySoldByItem” / “TotalQuantitySoldByOutlet”.
- Selling Price: The average selling price of each product/service. For example, within the filtered time period, if an item was sold 10 times, with 3 different prices: 2.5, 3, and 4.5, then the selling price will be the average of those 3 prices, which is 3.33.
- Total Gross Sales By Outlet: Sum of gross sales in outlet.
- Total Item Discounts By Outlet: Sum of Item Discount in outlet.
- Total Sale Less Item Discount By Outlet: Sum of Sale Less Item Discount in outlet
- Total % Sales By Outlet: Sum of % Sales in outlet. Should be 100%.
- Total Quantity Sold By Outlet: Sum of quantity sold in outlet.
- Total % Quantity Sold By Outlet: Sum of % Quantity Sold in outlet. Should be 100%.
- Average Selling Price By Outlet: Average of Selling Price in outlet.
<